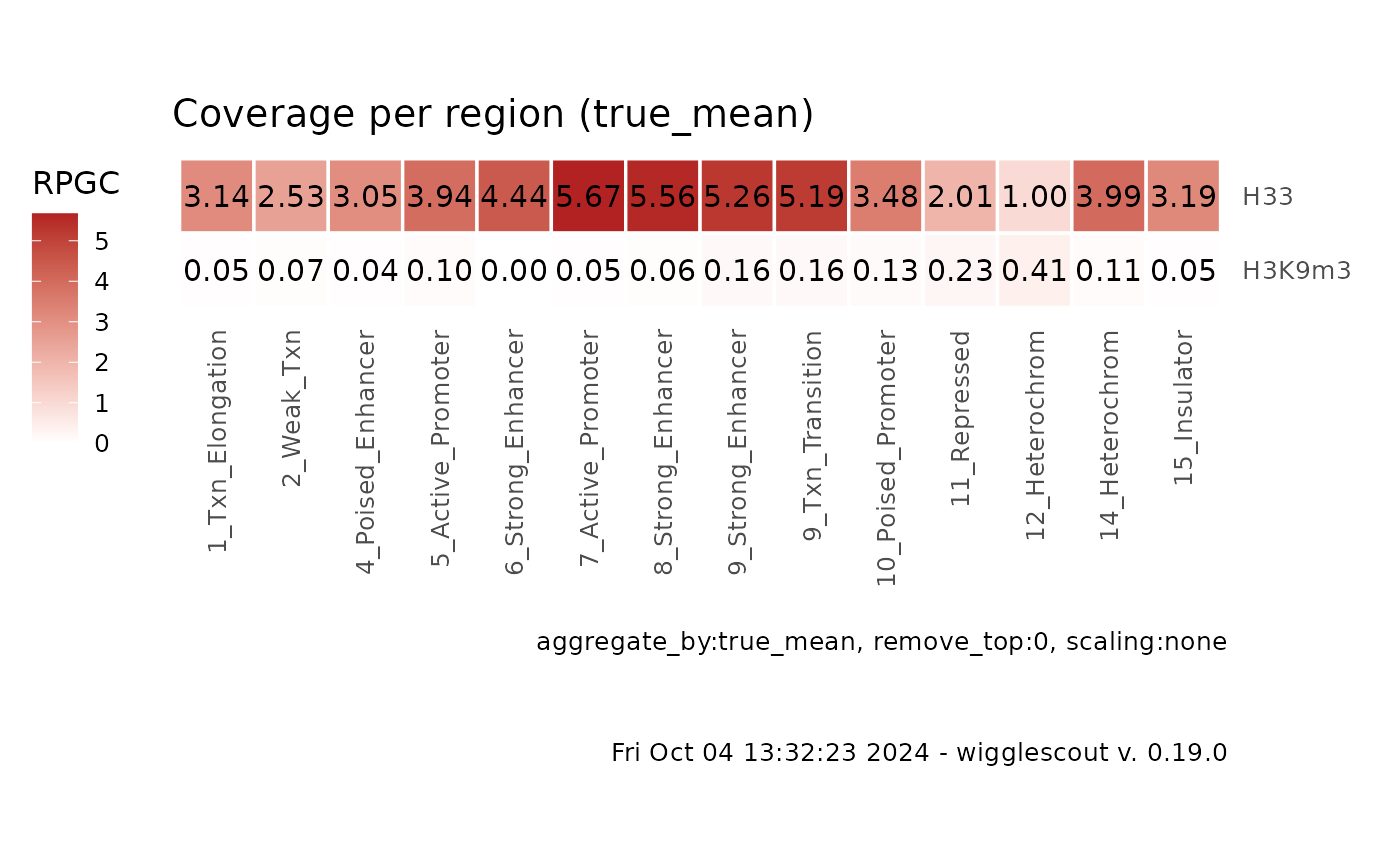
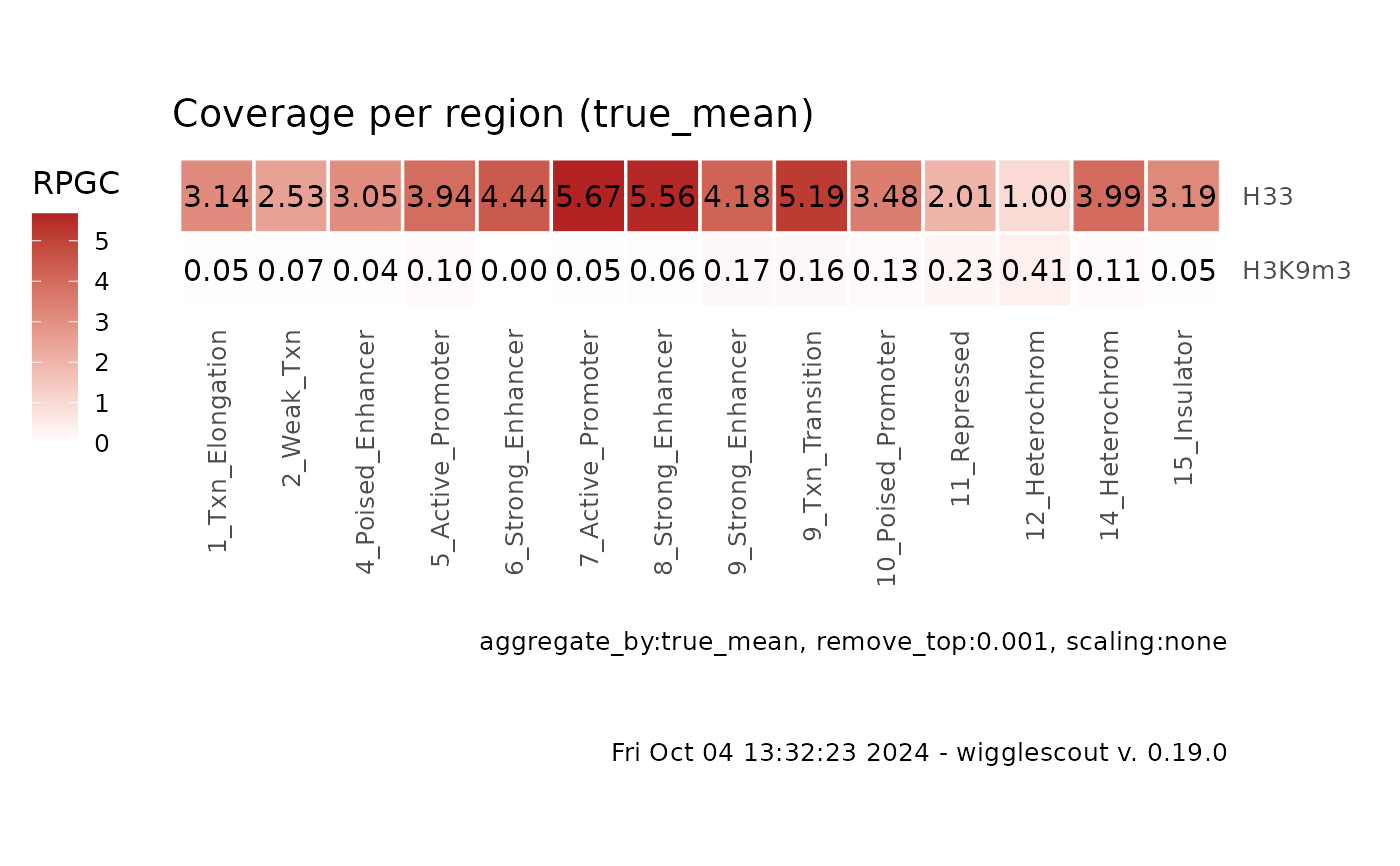
Summary heatmap of a categorized BED or GRanges object
Source:R/bwplot.R
plot_bw_loci_summary_heatmap.RdMake a summary heatmap where each cell contains an aggregated value of a bigWig file from bwfiles and a category of a BED file or GRanges (loci). The provided loci must have a name field that is valid (i.e. can be grouped, representing some type of category).
Usage
plot_bw_loci_summary_heatmap(
  bwfiles,
  loci,
  bg_bwfiles = NULL,
  labels = NULL,
  aggregate_by = "true_mean",
  norm_mode = "fc",
  remove_top = 0,
  verbose = TRUE,
  default_na = NA_real_,
  scaling = "none"
)
Arguments
- bwfiles
Path or array of paths to the bigWig files to be summarized.
- loci
BED file or GRanges object.
- bg_bwfiles
Path or array of paths to the bigWig files to be used as background.
- labels
Labels to use for in the plot for the bw files.
- aggregate_by
Statistic to aggregate per group. If NULL, values are not aggregated. This is the behavior by default.
- norm_mode
Function to apply to normalize bin values. Default fc: divides bw / bg. Alternative: log2fc: returns log2(bw/bg).
- remove_top
Return range 0-(1-remove_top). By default returns the whole distribution (remove_top == 0).
- verbose
Put a caption with relevant parameters on the plot.
- default_na
Default value for missing values
- scaling
If none, no operation is performed (default). If relative, values are divided by global mean (1x genome coverage).
Examples
# Get the raw files
bw <- system.file("extdata", "sample_H33_ChIP.bw", package = "wigglescout")
bw2 <- system.file("extdata",
                   "sample_H3K9me3_ChIP.bw", package = "wigglescout")
bed <- system.file("extdata", "sample_chromhmm.bed", package = "wigglescout")

plot_bw_loci_summary_heatmap(c(bw, bw2), loci = bed,
                             labels = c("H33", "H3K9m3"))


plot_bw_loci_summary_heatmap(c(bw, bw2), loci = bed, remove_top = 0.001,
                             labels = c("H33", "H3K9m3"))
