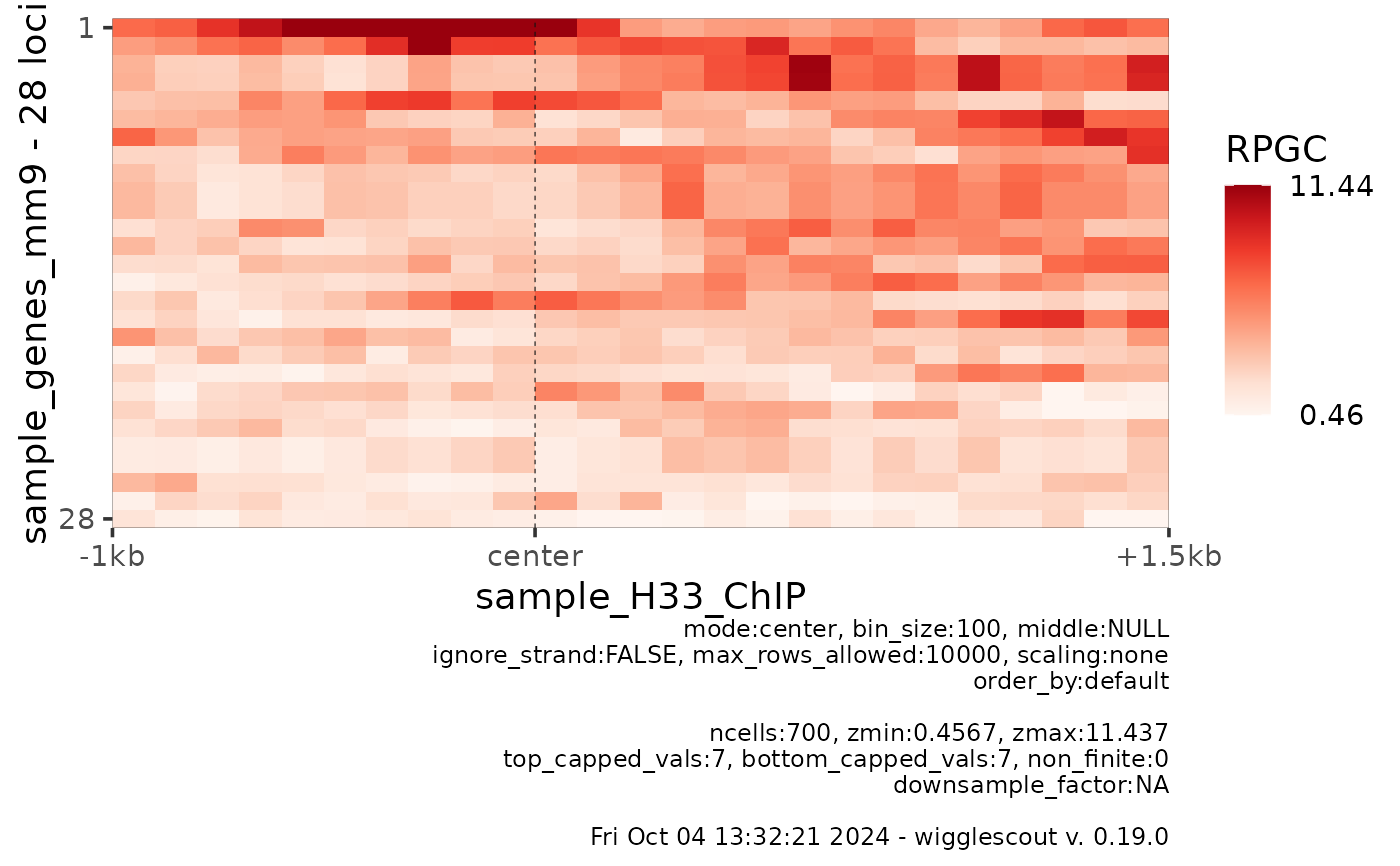
Plot a heatmap of a given bigWig file over a set of loci
Usage
plot_bw_heatmap(
  bwfiles,
  loci,
  bg_bwfile = NULL,
  mode = "stretch",
  bin_size = 100,
  upstream = 2500,
  downstream = 2500,
  middle = NULL,
  ignore_strand = FALSE,
  norm_mode = "fc",
  cmap = "Reds",
  zmin = NULL,
  zmax = NULL,
  max_rows_allowed = 10000,
  order_by = NULL,
  verbose = TRUE,
  default_na = NA_real_,
  scaling = "none"
)
Arguments
- bwfiles
BigWig file to plot
- loci
BED file or GRanges to summarize
- bg_bwfile
Background bw file. Use this with care. Depending on bin size and actual values, this may result in a very noisy plot.
- mode
How to handle differences in lengths across loci:
stretch: Anchor each locus on both sides.
start: Anchor all loci on start.
end: Anchor all loci on end.
center: Center all loci.
- bin_size
Bin size. Length of bin in base pairs. The lower, the higher the resolution.
- upstream
Number of base pairs to include upstream of loci.
- downstream
Number of base pairs to include downstream of loci.
- middle
Number of base pairs that the middle section has (in stretch mode). If not provided, median length of all loci is used.
- ignore_strand
Whether to use strand information in BED file.
- norm_mode
Function to apply to normalize bin values. Default fc: divides bw / bg. Alternative: log2fc: returns log2(bw/bg).
- cmap
Color map. Any RColorBrewer palette name is accepted here.
- zmin
Minimum of the color scale. Majority of tools set this to 0.01 percentile of the data distribution.
- zmax
Maximum of the color scale. Majority of tools set this to 0.99.
- max_rows_allowed
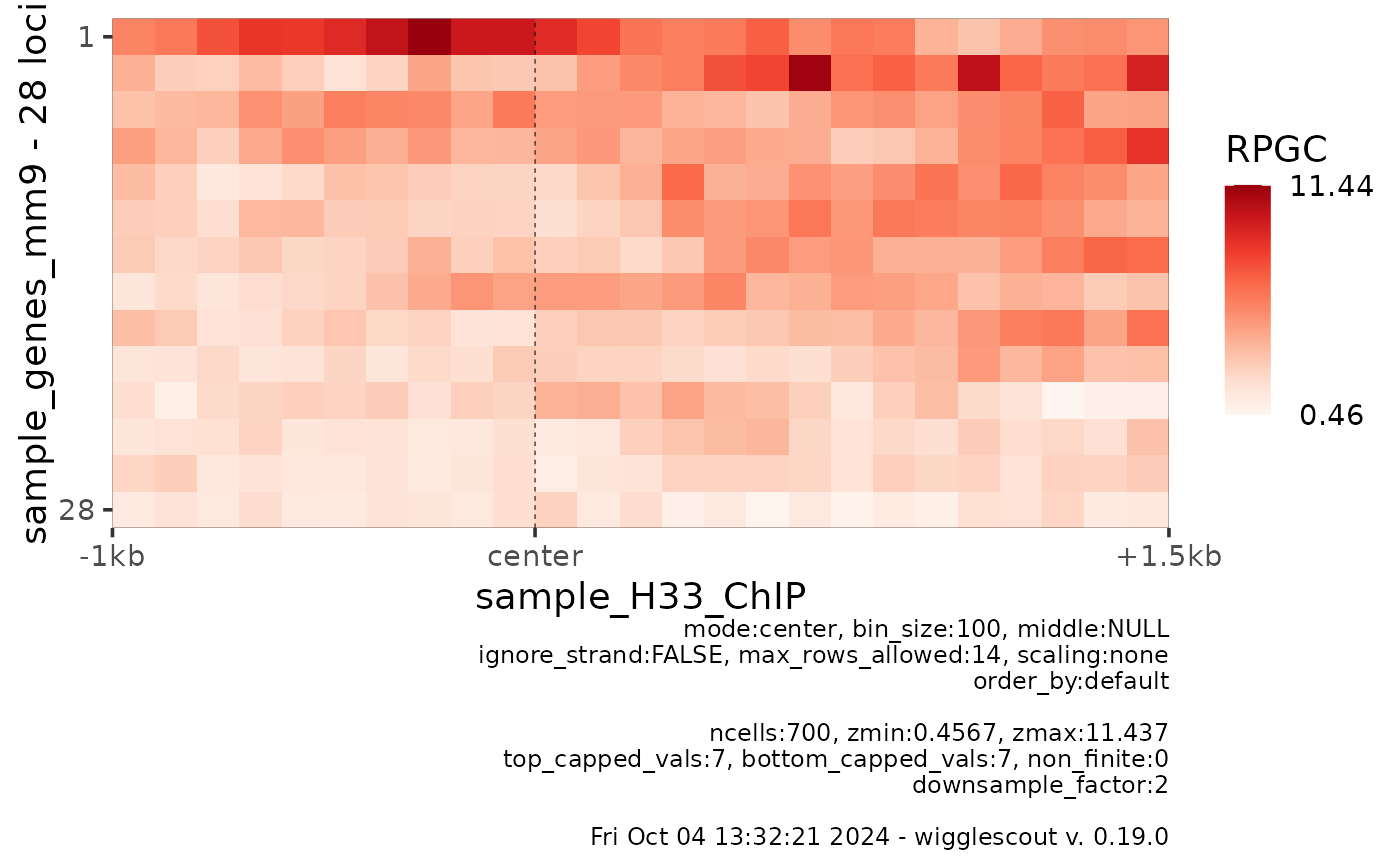
Maximum number of loci that will be allowed in the plot. If the amount of loci exceeds this value, the plot will be binned on the y axis until it fits max_rows_allowed. This speeds up plotting of very large matrices, where higher resolution would not be perceivable by eye.
- order_by
Specific order to display rows. By default rows are sorted decreasingly by mean. Order should be an array of integers of the same length as number of rows. These can be obtained as a result of order() function, if one would want to sort one heatmap by values on another one.
- verbose
Put a caption with relevant parameters on the plot.
- default_na
Default value for missing values
- scaling
Whether to use the bigWig values as they are (none - default) or calculate relative enrichment (relative) by dividing values by global average.
Examples
# Get the raw files
bw <- system.file("extdata", "sample_H33_ChIP.bw", package="wigglescout")
bed <- system.file("extdata", "sample_genes_mm9.bed", package="wigglescout")


plot_bw_heatmap(bw, loci = bed,
                mode = "center", upstream = 1000, downstream = 1500)


# If resolution is lower than number of rows, rows are aggregated
plot_bw_heatmap(bw, loci = bed,
                mode = "center", upstream = 1000, downstream = 1500,
                max_rows_allowed = 14)
#> Warning: Large matrix: 28. Downscaled to 14
