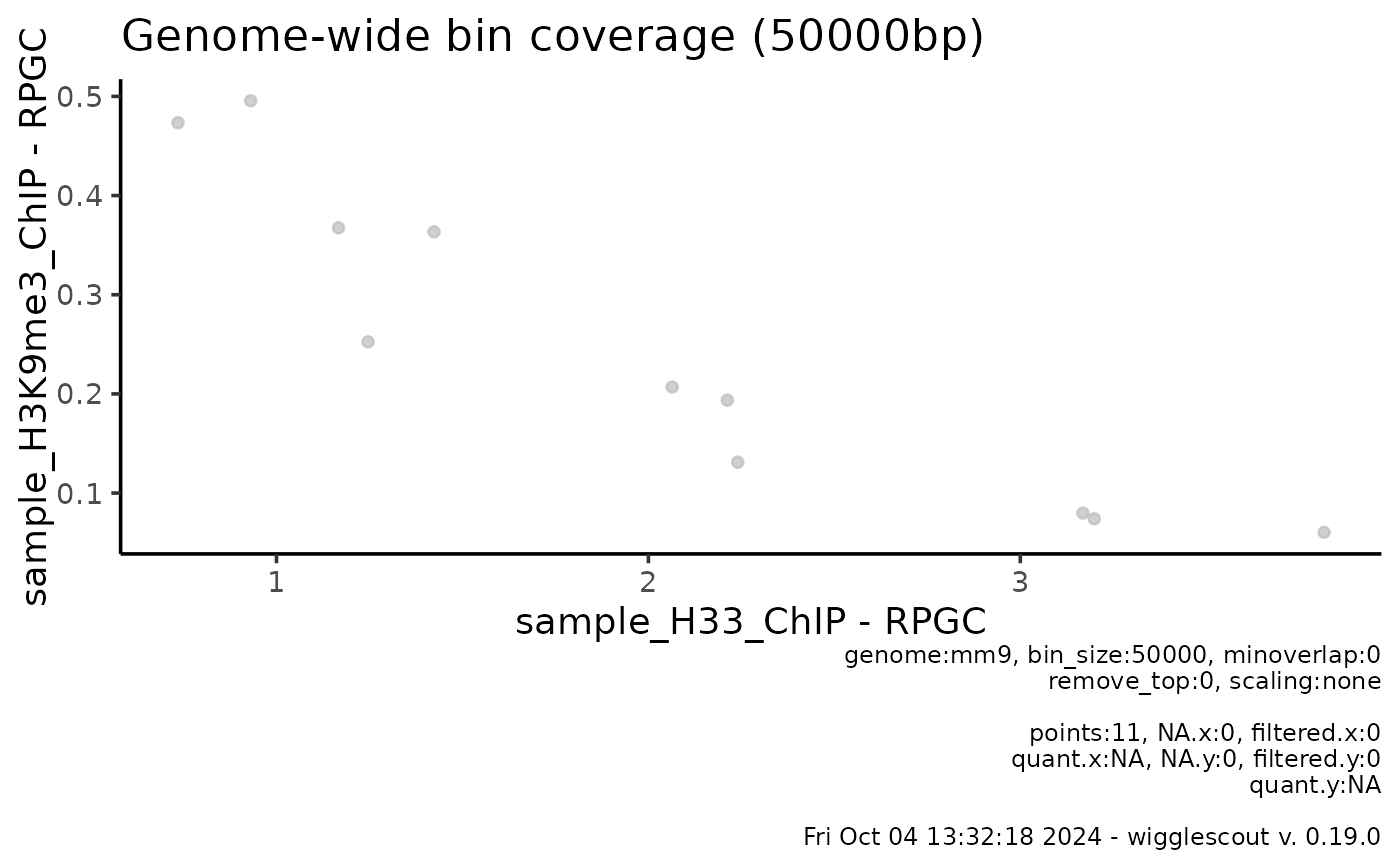
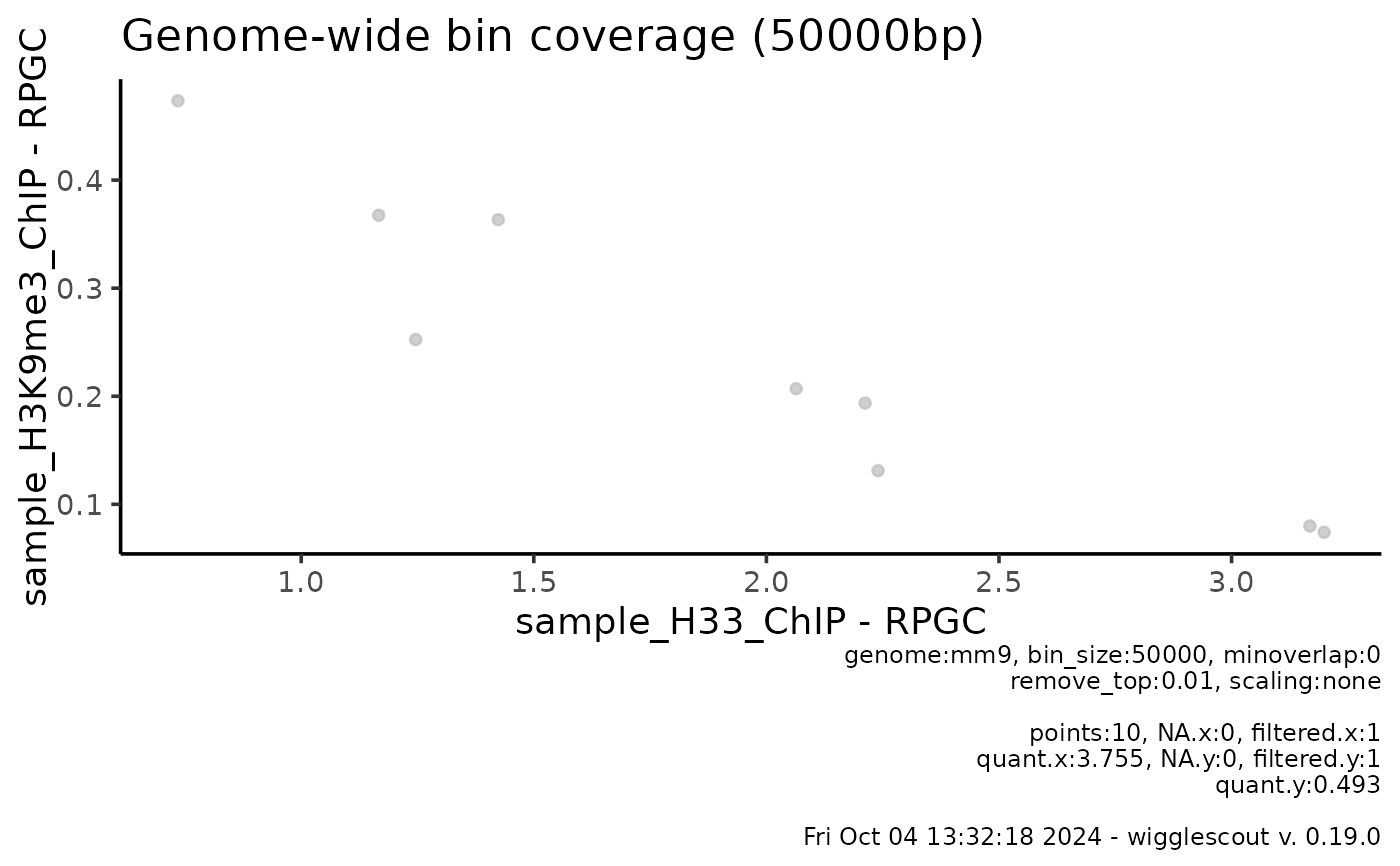
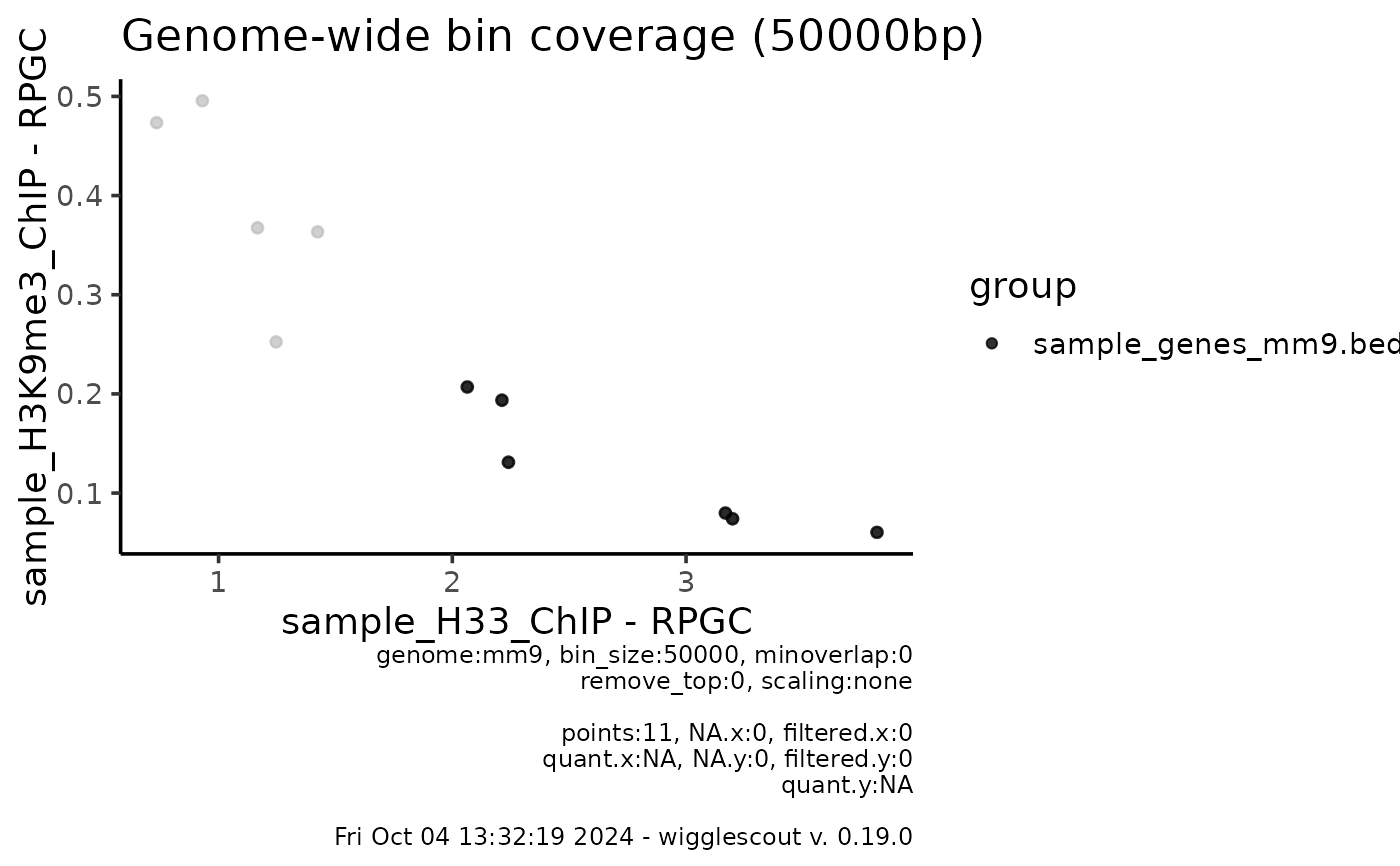
Plots a scatter plot from two given bigWig files and an optional set of BED files as highlighted annotations. Bins are highlighted if there is at least minoverlap base pairs overlap with any loci in BED file.
Usage
plot_bw_bins_scatter(
  x,
  y,
  bg_x = NULL,
  bg_y = NULL,
  norm_mode_x = "fc",
  norm_mode_y = "fc",
  bin_size = 10000,
  genome = "mm9",
  highlight = NULL,
  minoverlap = 0L,
  highlight_label = NULL,
  highlight_colors = NULL,
  remove_top = 0,
  verbose = TRUE,
  selection = NULL,
  default_na = NA_real_,
  scaling = "none",
  density = FALSE,
  canonical = FALSE
)
Arguments
- x
BigWig file corresponding to the x axis.
- y
BigWig file corresponding to the y axis.
- bg_x
BigWig file to be used as x axis background (us. input).
- bg_y
BigWig file to be used as y axis background (us. input).
- norm_mode_x
Normalization mode for x axis.
- norm_mode_y
Normalization mode for y axis.
- bin_size
Bin size.
- genome
Genome. Available choices are mm9, hg38.
- highlight
List of bed files to use as highlight for subgroups.
- minoverlap
Minimum overlap required for a bin to be highlighted
- highlight_label
Labels for the highlight groups. If not provided, filenames are used.
- highlight_colors
Array of color values for the highlighting groups
- remove_top
Return range 0-(1-remove_top). By default returns the whole distribution (remove_top == 0).
- verbose
Put a caption with relevant parameters on the plot.
- selection
A GRanges object to restrict binning to a certain set of intervals. This is useful for debugging and improving performance of locus specific analyses.
- default_na
Default value for missing values
- scaling
If none, no operation is performed (default). If relative, values are divided by global mean (1x genome coverage).
- density
Plot 2d histogram instead (deprecated - use plot_bw_bins_density instead)
- canonical
Use only canonical chromosomes (default: FALSE)
Details
If specifying minoverlap, you must take into account the bin_size parameter and the size of the loci you are providing as BED file.
Values in x and y axis can be normalized using background bigWig files (usually input files). By default, the value shown will be x / bg_x per bin. If norm_func_x or norm_func_y are provided, this can be changed to any given function, for instance, if norm_func_x = log2, values on the x axis will represent log2(x / bg_x) for each bin.
Values that are invalid (NaN, Inf, -Inf) in doing such normalization will be ignored and shown as warnings, as this is ggplot default behavior.
Examples
# Get the raw files
bw <- system.file("extdata", "sample_H33_ChIP.bw", package="wigglescout")
bw2 <- system.file("extdata",
"sample_H3K9me3_ChIP.bw", package="wigglescout")
bed <- system.file("extdata", "sample_genes_mm9.bed", package="wigglescout")
# Sample bigWig files only have valid values on this region
locus <- GenomicRanges::GRanges(
seqnames = "chr15",
IRanges::IRanges(102600000, 103100000)
)
plot_bw_bins_scatter(bw, bw2, bin_size = 50000, selection = locus)
#> Warning: Not all bigWig files or the genome tiling provided share the same sequence info.
#> Common to all (1): chr15
#> Missing in some of the files: chr1, chr2, chr3, chr4, chr5 ...
#> This can be due to different versions of the same reference genome, or to completely different organisms. Make sure these match!
 plot_bw_bins_scatter(bw, bw2, bin_size = 50000, selection = locus,
remove_top = 0.01)
#> Warning: Not all bigWig files or the genome tiling provided share the same sequence info.
#> Common to all (1): chr15
#> Missing in some of the files: chr1, chr2, chr3, chr4, chr5 ...
#> This can be due to different versions of the same reference genome, or to completely different organisms. Make sure these match!
#> Warning: Removed 1 row containing missing values or values outside the scale range
#> (`geom_point()`).
 plot_bw_bins_scatter(bw, bw2, bin_size = 50000, selection = locus,
highlight = bed, highlight_color = "black")
#> Warning: Not all bigWig files or the genome tiling provided share the same sequence info.
#> Common to all (1): chr15
#> Missing in some of the files: chr1, chr2, chr3, chr4, chr5 ...
#> This can be due to different versions of the same reference genome, or to completely different organisms. Make sure these match!
