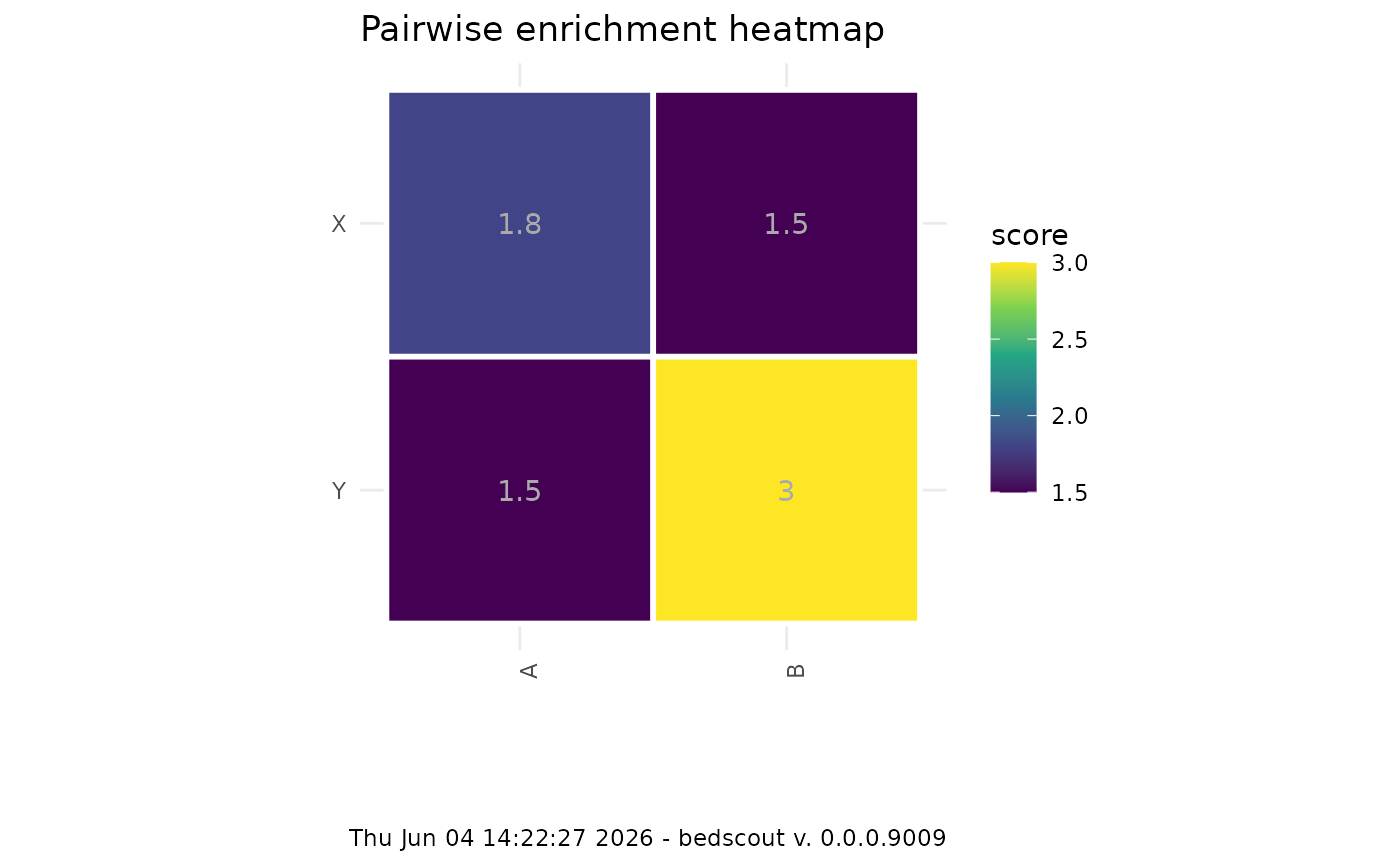
Plot pairwise enrichment heatmap
plot_pairwise_score.RdPlot pairwise enrichment heatmap
Examples
gr_a1 <- GenomicRanges::GRanges(seqnames = c("chr1"), IRanges::IRanges(11, 20), strand = "-")
gr_a2 <- GenomicRanges::GRanges(seqnames = c("chr1"), IRanges::IRanges(24, 25), strand = "+")

gr_b1 <- GenomicRanges::GRanges(seqnames = c("chr1"), IRanges::IRanges(15, 24), strand = "-")
gr_b2 <- GenomicRanges::GRanges(seqnames = c("chr1"), IRanges::IRanges(16, 25), strand = "+")

gsize <- 30

score_func <- purrr::partial(fc_enrichment, genome_size = gsize, ignore.strand = TRUE)

plot_pairwise_score(
  list("A" = gr_a1, "B" = gr_a2),
  list("X" = gr_b1, "Y" = gr_b2),
  score_func
)